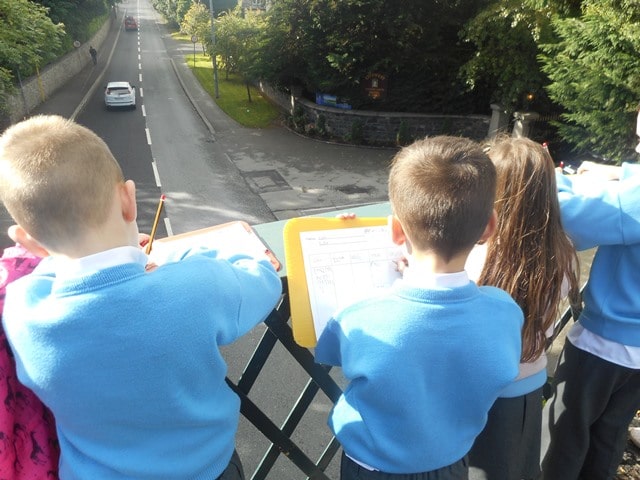
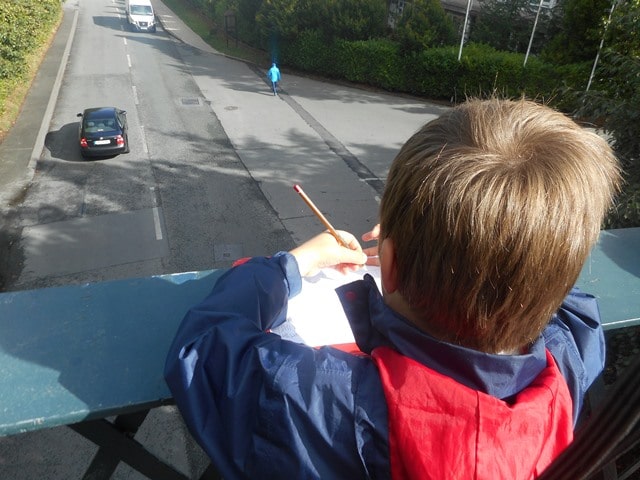
On Tuesday, we walked to the Citywest Hotel bridge. We were collecting information about the vehicles on the street. We call that data. We were counting how many vehicles went under the bridge. We used tally marks to help us record. We had to be very careful on the bridge and walking on the footpath.
When we came back to the classroom we drew a graph using the squares in our copies. The cars were the most popular vehicles. Motor bikes, tractors and buses were the least popular vehicles.
To view more images click here.